Converting FITS Files to a hepfile#
Flexible Image Transport System (FITS) files are a fast file format commonly used in astronomy to store image and spectra data taken with telescopes. This tutorial will show you how to take multiple fits files and easily and efficiently store them in a single hepfile. This conversion can be especially useful if you have a bunch of FITS data from different telescopes, with different CCDs and therefore different data dimensions, and want to store it in a single file.
Software Installation and Data Download#
Before continuing with the tutorial, we have to install astropy and download some open source FITS files. We first pip install astropy:
[1]:
!pip install astropy
Defaulting to user installation because normal site-packages is not writeable
Requirement already satisfied: astropy in /home/nfranz/.local/lib/python3.8/site-packages (5.2.2)
Requirement already satisfied: numpy>=1.20 in /home/nfranz/.local/lib/python3.8/site-packages (from astropy) (1.23.5)
Requirement already satisfied: pyerfa>=2.0 in /home/nfranz/.local/lib/python3.8/site-packages (from astropy) (2.0.0.3)
Requirement already satisfied: PyYAML>=3.13 in /usr/lib/python3/dist-packages (from astropy) (5.3.1)
Requirement already satisfied: packaging>=19.0 in /home/nfranz/.local/lib/python3.8/site-packages (from astropy) (23.0)
Now we can import astropy along with other software we will need for this tutorial!
[2]:
# imports
import os, glob
import hepfile as hf
import numpy as np
import matplotlib.pyplot as plt
from astropy.io import fits
from astropy.table import Table
Now we run some other bash commands to grab a relatively small zip file of fits data on the Eagle Nebula, unzip them, and clean up the directory by removing unnecessary files. This will leave behind three FITS files of images taken at three different wavelengths: 502nm, 656nm, and 673nm. This data is from NOIRLab and you can find information on it here.
[3]:
# download some "small" public fits images, unzip them, and clean up the directory
# this downloads three fits files from noirlab with observations of the eagle nebula at 3 different wavelengths
if not os.path.exists('502nmos.fits') or not os.path.exists('656nmos.fits') or not os.path.exists('673nmos.fits'):
    !wget 'https://noirlab.edu/public/media/archives/education/zip/edu008.zip'
    !unzip -o 'edu008.zip'
    !unzip -o '*.zip'
    !rm -rf '__MACOSX'
    !rm *.zip
    !rm *.psd
else:
    print('Skipping download, files already exist!')
Skipping download, files already exist!
Exploring the FITS File Structure#
Now that we have the data downloaded and astropy installed, we can look at the data. First, let’s take a look at the info on the different tables in the three FITS files:
[4]:
# first grab all the fits files in the working directory
fitsfiles = glob.glob(os.path.join(os.getcwd(), '*.fits'))

# let's open the files
fitsdata = []
for f in fitsfiles:
    hdu_list = fits.open(f)
    print(hdu_list.info()) # this shows all the info
    print()
    fitsdata.append(hdu_list)
Filename: /home/nfranz/research/hepfile/docs/example_nb/673nmos.fits
No.    Name      Ver    Type      Cards   Dimensions   Format
  0  PRIMARY       1 PrimaryHDU     289   (1600, 1600)   float32
  1  673nmos_cvt.tab    1 TableHDU       353   1R x 49C   [D25.17, D25.17, E15.7, E15.7, E15.7, E15.7, E15.7, E15.7, E15.7, E15.7, A1, E15.7, I12, I12, D25.17, D25.17, A8, A8, I12, E15.7, E15.7, E15.7, E15.7, E15.7, E15.7, I12, I12, I12, I12, I12, I12, I12, I12, A48, E15.7, E15.7, E15.7, E15.7, E15.7, E15.7, E15.7, E15.7, E15.7, E15.7, E15.7, E15.7, E15.7, E15.7, E15.7]
None

Filename: /home/nfranz/research/hepfile/docs/example_nb/502nmos.fits
No.    Name      Ver    Type      Cards   Dimensions   Format
  0  PRIMARY       1 PrimaryHDU     290   (1600, 1600)   float32
  1  502nmos_cvt.tab    1 TableHDU       353   1R x 49C   [D25.17, D25.17, E15.7, E15.7, E15.7, E15.7, E15.7, E15.7, E15.7, E15.7, A1, E15.7, I12, I12, D25.17, D25.17, A8, A8, I12, E15.7, E15.7, E15.7, E15.7, E15.7, E15.7, I12, I12, I12, I12, I12, I12, I12, I12, A48, E15.7, E15.7, E15.7, E15.7, E15.7, E15.7, E15.7, E15.7, E15.7, E15.7, E15.7, E15.7, E15.7, E15.7, E15.7]
None

Filename: /home/nfranz/research/hepfile/docs/example_nb/656nmos.fits
No.    Name      Ver    Type      Cards   Dimensions   Format
  0  PRIMARY       1 PrimaryHDU     290   (1600, 1600)   float32
  1  656nmos_cvt.tab    1 TableHDU       353   1R x 49C   [D25.17, D25.17, E15.7, E15.7, E15.7, E15.7, E15.7, E15.7, E15.7, E15.7, A1, E15.7, I12, I12, D25.17, D25.17, A8, A8, I12, E15.7, E15.7, E15.7, E15.7, E15.7, E15.7, I12, I12, I12, I12, I12, I12, I12, I12, A48, E15.7, E15.7, E15.7, E15.7, E15.7, E15.7, E15.7, E15.7, E15.7, E15.7, E15.7, E15.7, E15.7, E15.7, E15.7]
None
It looks like each FITS file has both data, stored in the PrimaryHDU, and metadata about the observation, stored in the TableHDU. In astropy, we can easily access this data by indexing by the No. column, where 0 is the primary data and 1 is the metadata. Once we do that, we can easily plot the data to make sure it looks like we think it should:
[5]:
allinfo = []
imgs = []
for d in fitsdata:
    img = np.array(d[0].data)
    info = Table(d[1].data)

    print(info)

    allinfo.append(info)
    imgs.append(img)
      CRVAL1           CRVAL2      CRPIX1 CRPIX2    CD1_1         CD1_2     ... MEANC25  MEANC50  MEANC100 MEANC200 MEANC300 BACKGRND
----------------- ---------------- ------ ------ ------------ ------------- ... -------- -------- -------- -------- -------- --------
274.7115229948199 -13.816390682904  386.5  396.0 1.878013e-05 -2.031193e-05 ... 12.13334 13.59485 14.88939 12.93392 12.34968 7.897364
      CRVAL1              CRVAL2       CRPIX1 CRPIX2    CD1_1         CD1_2     ... MEANC50  MEANC100 MEANC200 MEANC300 BACKGRND
------------------ ------------------- ------ ------ ------------ ------------- ... -------- -------- -------- -------- --------
274.71130937176997 -13.816000630103998  386.5  396.0 1.878013e-05 -2.031193e-05 ... 10.78265 10.71748 9.907546  8.59161 3.285868
     CRVAL1            CRVAL2       CRPIX1 CRPIX2    CD1_1         CD1_2     ... MEANC50  MEANC100 MEANC200 MEANC300 BACKGRND
--------------- ------------------- ------ ------ ------------ ------------- ... -------- -------- -------- -------- --------
274.71149247724 -13.816384007183999  386.5  396.0 1.878013e-05 -2.031193e-05 ... 134.1882   132.23 114.3746 100.2731 42.37756
WARNING: VerifyWarning: Invalid keyword for column 11: Column disp option (TDISPn) may not use the 'L' format with ASCII table columns. The invalid value will be ignored for the purpose of formatting the data in this column. [astropy.io.fits.column]
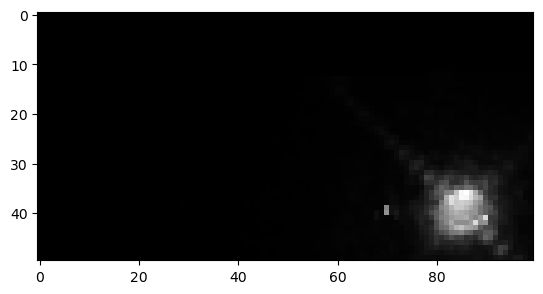
We are going to chop out part of the first two images so that we can show that hepfile can store different sized FITS files!
[6]:
imgs[0] = imgs[0][:100, :50]
imgs[1] = imgs[1][1000:, 1001:]
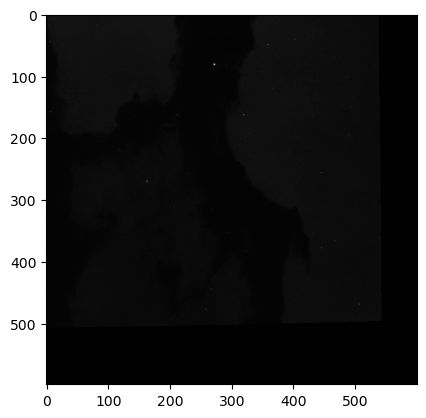
Now we can plot the updated Eagle Nebula images!
[7]:
for img in imgs:
    plt.figure()
    plt.imshow(img.T, cmap='Greys_r') # transpose the images to get them upright


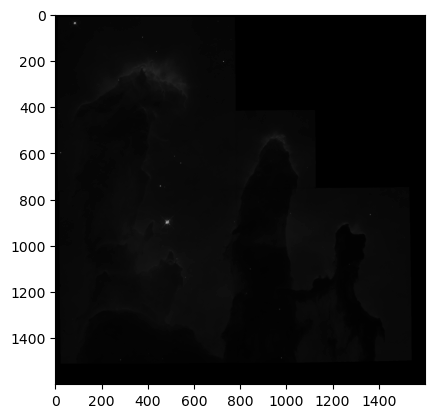
WOW! We can clearly see the structure of the Eagle Nebula in the bottom image and some other interesting details in the other two images! (if you can’t see this on the readthedocs page and you are in dark mode, try switching to light mode for better contrast) These images don’t look as pretty as the images of the Eagle Nebula online but that’s because those images have a lot of post processing that go into them! That’s not what we’re here to do today, instead we want to try to store all of this data in a hepfile!
Storing FITS Files in a hepfile#
We can think of each of these images as “events” and create a dictionary from them. In this case, the image data is the important data that should be stored in a group while the metadata can easily be stored as singletons. Also, we will store the shape of the original image so that we can easily rederive the image after reading the data. We can create a list of dictionaries of the data will allow us to easily pack the FITS data into a hepfile using the hepfile.dict_tools module.
[8]:
events = []
for img, meta in zip(imgs, allinfo):

    event_dict = {}
    for key in meta.keys():
        # these are all the singleton values
        event_dict[key] = meta[key].value[0]

    # we have the save the image shape as singletons as well
    # this will allow us to rederive the images from the hepfile
    event_dict['x'], event_dict['y'] = img.shape

    # then we initiate a group called 'imgs' that will store image data
    event_dict['imgs'] = {}

    # save the flattened pixel values in the group
    event_dict['imgs']['pixel_values'] = img.flatten()

    events.append(event_dict)
I would show you the events list but it is massively long so it takes up a lot of space in the notebook. Instead, you can imagine that it looks like a larger version of the list from the Writing Hepfiles From Dictionaries tutorial. Now we can store this dictionary in a hepfile using hepfile.dict_tools.dictlike_to_hepfile
[9]:
# put this data in a hepfile
data = hf.dict_tools.dictlike_to_hepfile(events, 'eagle-nebula.h5', how_to_pack='classic', write_hepfile=True)
print(data.keys())
dict_keys(['_GROUPS_', '_MAP_DATASETS_TO_COUNTERS_', '_LIST_OF_COUNTERS_', '_SINGLETONS_GROUP_/COUNTER', '_MAP_DATASETS_TO_DATA_TYPES_', '_META_', 'CRVAL1', 'CRVAL2', 'CRPIX1', 'CRPIX2', 'CD1_1', 'CD1_2', 'CD2_1', 'CD2_2', 'DATAMIN', 'DATAMAX', 'MIR_REVR', 'ORIENTAT', 'FILLCNT', 'ERRCNT', 'FPKTTIME', 'LPKTTIME', 'CTYPE1', 'CTYPE2', 'DETECTOR', 'DEZERO', 'BIASEVEN', 'BIASODD', 'GOODMIN', 'GOODMAX', 'DATAMEAN', 'GPIXELS', 'SOFTERRS', 'CALIBDEF', 'STATICD', 'ATODSAT', 'DATALOST', 'BADPIXEL', 'OVERLAP', 'PHOTMODE', 'PHOTFLAM', 'PHOTZPT', 'PHOTPLAM', 'PHOTBW', 'MEDIAN', 'MEDSHADO', 'HISTWIDE', 'SKEWNESS', 'MEANC10', 'MEANC25', 'MEANC50', 'MEANC100', 'MEANC200', 'MEANC300', 'BACKGRND', 'x', 'y', 'imgs/nimgs', 'imgs/pixel_values'])
And we’ve done it! We have successfully converted a set of FITS files to a hepfile. The nice thing about this method is that if you have FITS files of different sizes, possibly from different telescopes, they can all be stored in a single hepfile using this method!
Unpacking FITS data stored in a hepfile#
Now, we can unpack the FITS image data we just stored in a hepfile and plot them up to see what they look like!
[10]:
nimgs = len(data['imgs/nimgs'])
curr_idx = 0 # keep track of current starting index
for i in range(nimgs):

    newidx = data['imgs/nimgs'][i] + curr_idx
    pixels = data['imgs/pixel_values'][curr_idx:newidx]
    img = np.reshape(pixels, (data['x'][i], data['y'][i]))
    plt.figure()
    plt.imshow(img.T, cmap='Greys_r')

    curr_idx = newidx

And they are identical to the original images we saved in the hepfile! This means we have a consistent way to pack and unpack FITS data of different sizes (say from different telescopes) into a single file!!!